Information Coefficient and Signal Decay [/ˌɪnˌfɔrˈmeɪʃən ˌkoʊəˈfɪʃənt ənd ˈsɪgnəl dɪˈkeɪ/] n - The Information Coefficient is the correlation between a forecast and the realized outcome that follows it. For a cross-sectional equity signal it is commonly the Spearman rank correlation between predicted and realized returns; for a time-series signal, the Pearson correlation between the forecasted direction or magnitude and what in truth occurred.
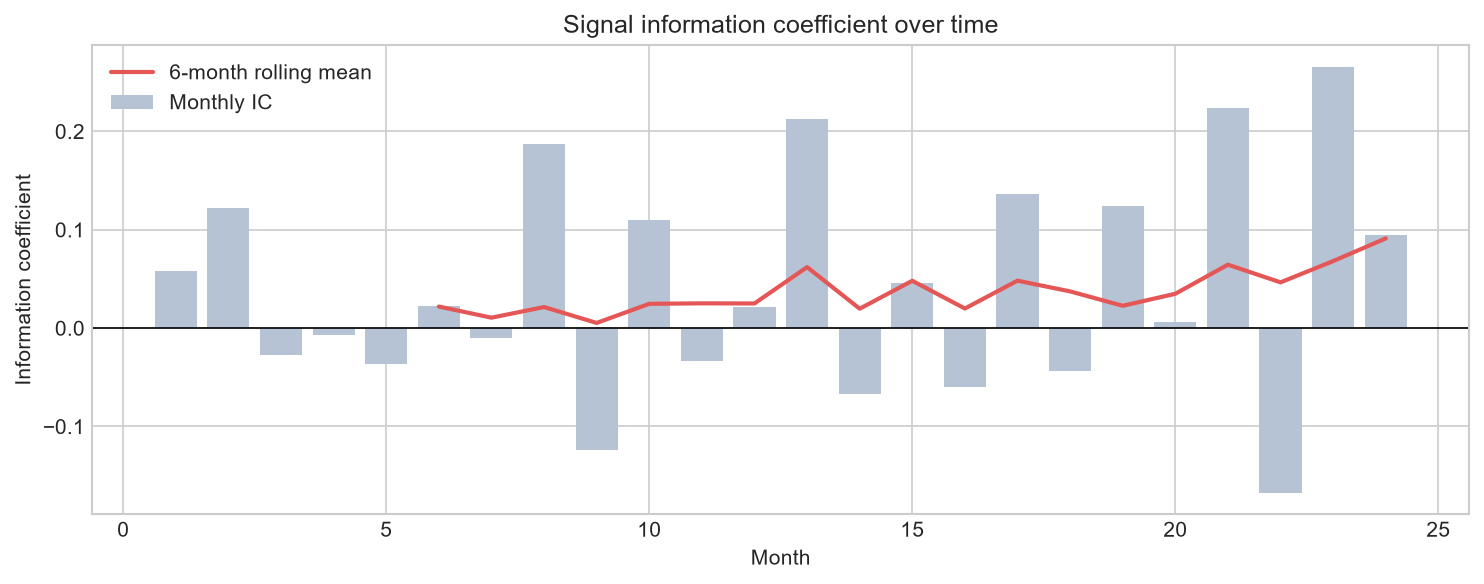 Information coefficient over time
The ideal is a stable positive mean IC with low volatility. A signal of average IC 0.05 and standard deviation 0.10 is far more useful than one of average IC 0.08 and standard deviation 0.20; what matters is the ratio of mean IC to its standard deviation, sometimes named the information ratio of the signal.
Signal decay measures how swiftly the IC falls as the forecast horizon lengthens. A momentum signal may bear a positive IC at one month and a negative at one year; a mean-reversion signal, a negative IC at one day and a positive at one quarter. Decay determines holding period and turnover.
The autocorrelation of the signal itself betrays capacity and implementation constraints. A highly autocorrelated signal changes slowly and asks little turnover; one that oscillates rapidly looks well in a frictionless backtest yet bleeds transaction costs in production. See Market Impact and Optimal Execution for why turnover is dear.
IC analysis serves also as a diagnostic for Feature Engineering for Predictive Signals. If a feature shows a high univariate IC yet adds nothing in a multivariate model, it is commonly a proxy for something the model already holds. The marginal IC is what counts.
Decay is not constant. Regime shifts can hasten it or turn it about, and a signal that has served for years may suddenly cease to serve. Watching rolling IC and detecting breaks is part of Alpha Decay and Model Lifecycle.