High-Frequency Data and Tick Analytics [/ˈhigh-frequensi ˈdætə ənd ˈtɪk ˌænəˈlɪtɪks/] n - High-frequency data is the raw record of market events: every trade, every quote change, sometimes every order book update. It holds information that vanishes in daily aggregations, yet it holds also noise, errors, and biases fit to mislead a model.
The first labor is cleaning. Bad ticks, delayed prints, and crossed quotes must be cast out before analysis, for a single bad tick can conjure a spurious signal. Cleaning rules ought to be documented and applied with one hand across the whole sample; any rule altered after the results are seen is a form of data snooping.
Trade classification parts trades into buyer-initiated and seller-initiated. The Lee-Ready algorithm judges by the trade price against the prevailing quote: trades at or above the ask are reckoned buyer-initiated, trades at or below the bid seller-initiated. Subtler methods employ order book reconstruction where the data permits.
Volume-weighted average price and time-weighted average price are the common benchmarks. VWAP compares the average fill price to the volume-weighted market price over the interval; TWAP compares to the time-weighted price. Both serve to judge execution quality. See Market Microstructure and Execution for the wider context.
Signature plots show how realized volatility or variance shifts with sampling frequency. At very high frequencies microstructure noise rules, and variance estimates are biased upward; at lower frequencies, useful signal is lost. The optimal sampling frequency balances these two afflictions.
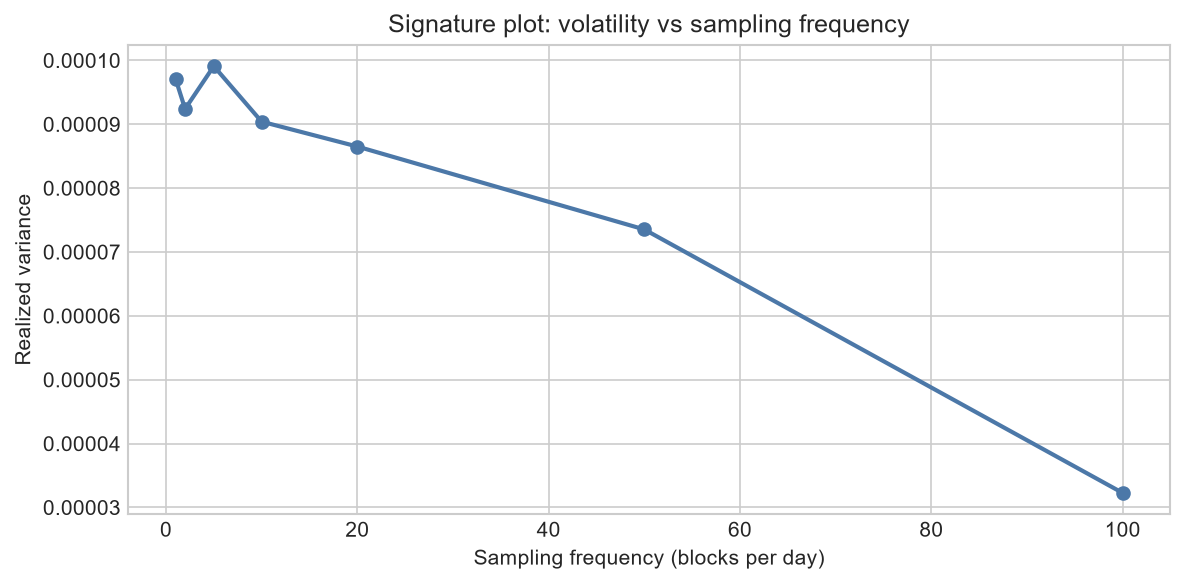 Signature plot: volatility versus sampling frequency
Tick analytics can measure order flow toxicity, liquidity resilience, and short-term price pressure. These signals decay within seconds or minutes, and to capture them demands low-latency infrastructure and a clear reckoning of how long the alpha endures.
The chief peril of high-frequency analysis is overfitting. With millions of observations, t-statistics are easily found, and most of them are noise. Out-of-sample testing on independent time periods is essential. See Backtesting and Multiple Comparison Bias for why great samples do not lift the need for discipline.